Helixor Code Local Desk
The Local Desk is the companion-served browser work surface available at /desk. It provides operational visibility into durable work state, active TODO stacks, architecture design documents, index catalogs, and runtime logs directly from your local machine.
Accessing The Local Desk
Open the Local Desk via the macOS tray icon or directly in your browser:
http://127.0.0.1:18733/deskFor candidate/sandbox runtime slots (slot 19):
http://127.0.0.1:19733/desk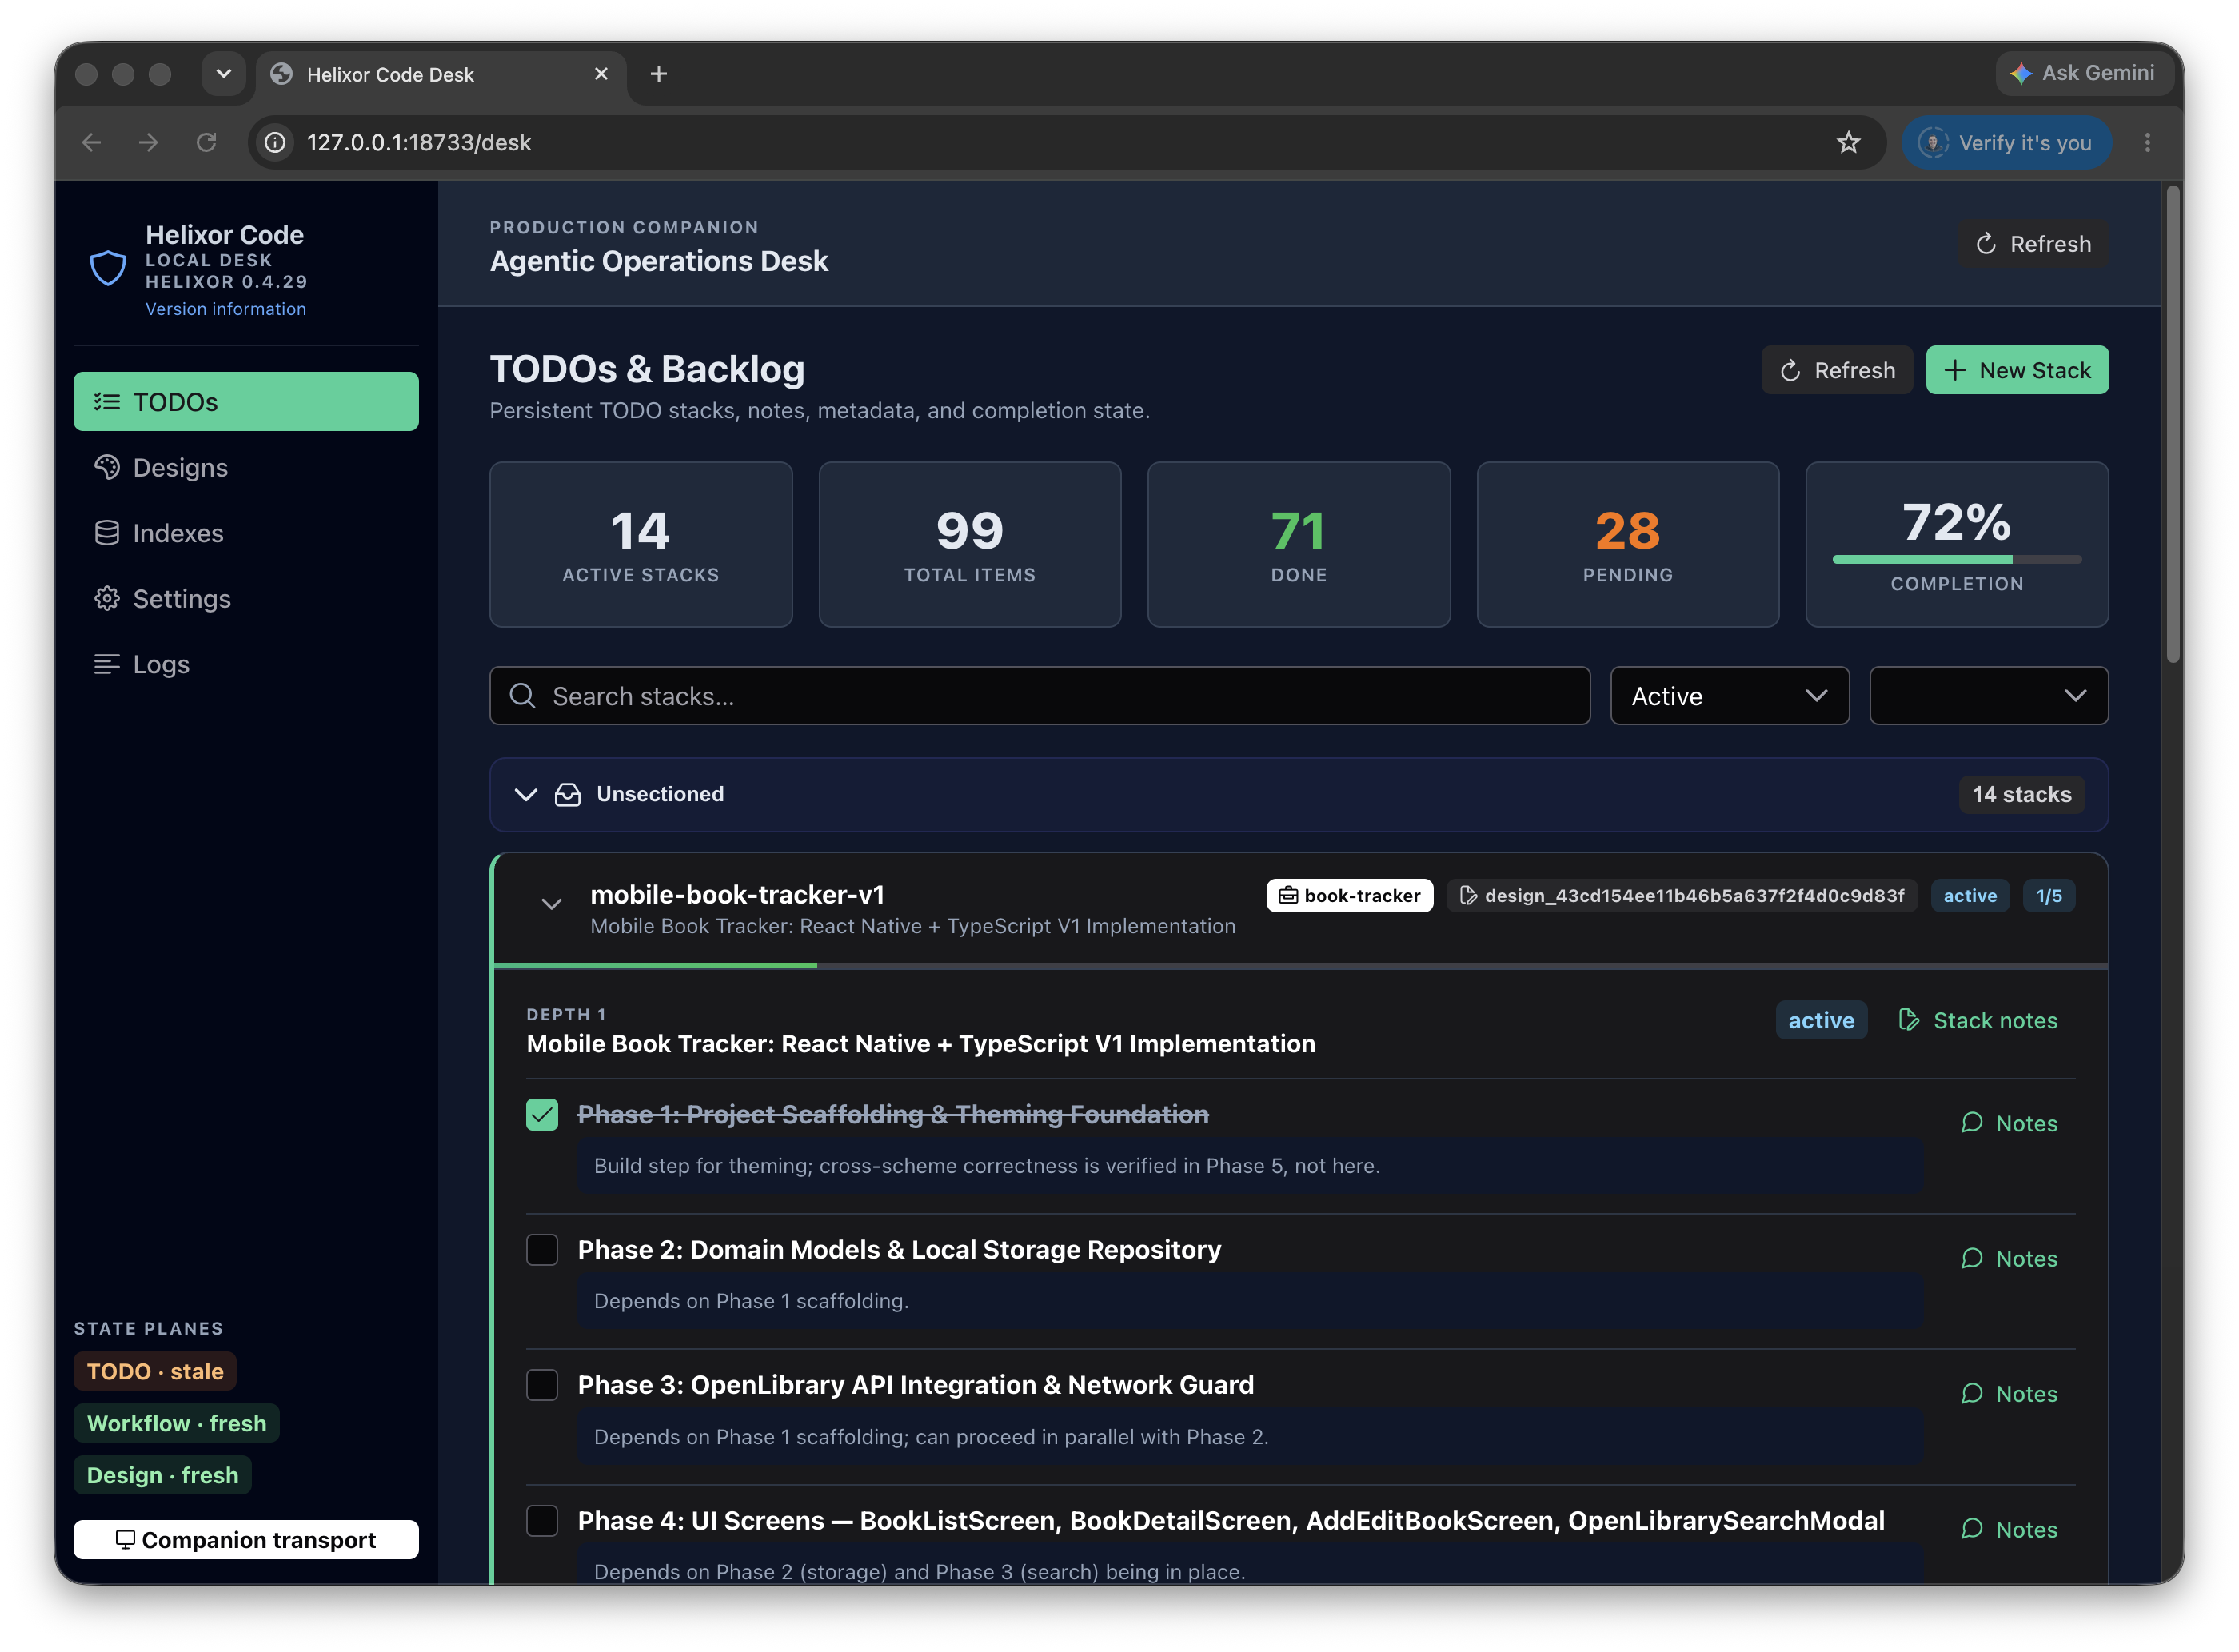
Surface Boundaries
The Local Desk is distinct from the Menu Bar Tray and the Cloud Portal:
| Surface | Primary Responsibility |
|---|---|
| Menu Bar Tray | Compact status indicator for companion health, idle/busy indicators, quick desk launch, and stop. |
| Local Desk | Full local work surface for TODO stacks, designs, code indexes, settings, logs, and feature-gated planes. |
| Cloud Portal | Organization-wide user management, billing, and team visibility. Does not own local execution state. |
State Planes & Authority
The Local Desk organizes state into distinct planes, clearly labeled with their source of authority and freshness:
| State Plane | Backing Source | Behavior & Persistence |
|---|---|---|
| TODO | brain.todo |
Durable TODO stacks shared across agents and developer sessions. |
| Design | brain.design |
Durable technical architecture documents and delivery phase tracking. |
| Workflow | Local SQLite / Portal | Beta, feature-gated SDLC orchestration execution graphs. |
| Narrative | Local Companion Events | Stream of recent tool calls, agent queries, and local audit events. |
Core Desk Views
1. TODOs Tab
The primary work surface for managing durable TODO stacks. It visualizes subject-scoped stacks, nested item levels, notes, and completion statuses.
- Filter by project ID or status (Active, Completed, Cancelled, Archived).
- Search across stack titles, subjects, and item details.
- Inspect nested item trees and add explanatory notes.
- Toggle completion status without switching to the CLI.
2. Designs Tab
Inspects technical architecture design records stored in brain.design. Displays full Markdown content, phase breakdowns, milestone checklists, and associated project metadata.
3. Indexes Tab
Provides a real-time catalog of all local code repositories indexed on your machine. Displays file counts, build durations, language breakdowns, node/edge counts, git freshness status, and quality assessment scores.
4. Settings & Logs
Inspect and adjust local companion port bindings, source roots, and index watch settings. The Logs view provides a live streaming console of companion activity, MCP requests, and diagnostics.